Table of Contents
ToggleHistory tends to repeat itself- (Stock market)
A big assumption to invest in the Stock market-“History tends to repeat itself”
As mentioned earlier on that assumption in technical analysis Is, we really on the fact that history tends to repeat itself. Which is one of the most probably important assumptions in technical analysis. .
it would make sense to explore this assumption in a great deal that this juncture as candlestick patterns are heavily dependent on it.
Look at the Candlestick Chart of the stock BATAINDIA from July 2019 to October 2019
Picture No.1
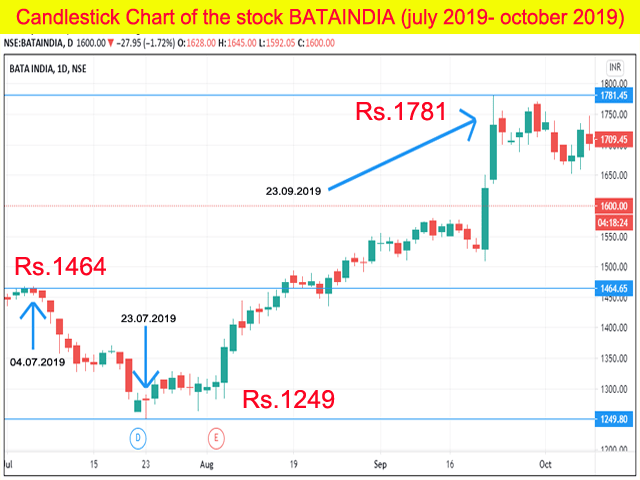
assume today, the 23rd of September 2019 there are few things happening in that particular stock. Let us try to understand.
- the stock has been falling from Rs 1464/- to Rs.1249/- in the trading session from 04.07.2019 to 23.07.2019
- After a small correction, the stock started climbing up gradually to reach Rs.1781/- on our assuming date i.e today, the 23rd of September 2019
- what will happen with the stock in the next couple of trading sessions from our assuming date 23rd of September 2019. Will it maintain its rising flow or decline for a correction. Can you predict that?
Absolutely right. It can’t be predicted unless having the proper knowledge of Fundamental Analysis (FA) and Technical Analysis (TA).
Anyway, look at the next part of the Candlestick Chart of the stock BATAINDIA from 04 July 2019 to July 2020. given below to understand what happened with the stock after our assuming Date i.e 23rd of September 2019.
Picture No.2
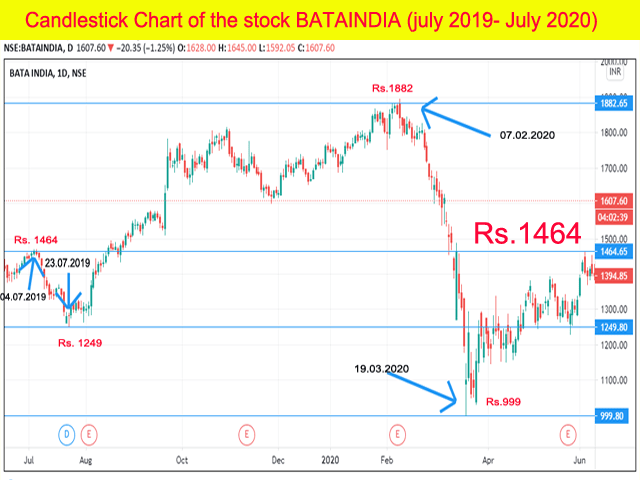
Look the stock struggled much to go up since our assuming date 23rd of September 2019. It managed to tough around Rs.1880/- on 07.02.2020 (Consolidated Zone).
And after that, it got highly corrected and the stock reached Rs.999/-. Did you predict it? Certainly not, Because the Market is unpredictable?
Definitely, Many weak traders may sell their stock at this level with booking their loss. But the market got bonce back. Why?
A very funny part here is that look at the chart, after a sharp fall, the stock again reached that level of Rs1464/-.from where this topic of discussion started. Here Rs.1464/- Repeated again means History repeated again.
So now a question may arise that, will the stock touch again the top of Rs.1880 to repeat the history again.
To get such an answer, observe the following image of the Candlestick Chart of the stock BATAINDIA from Feb 2019 to Dec 2020
Picture No.3
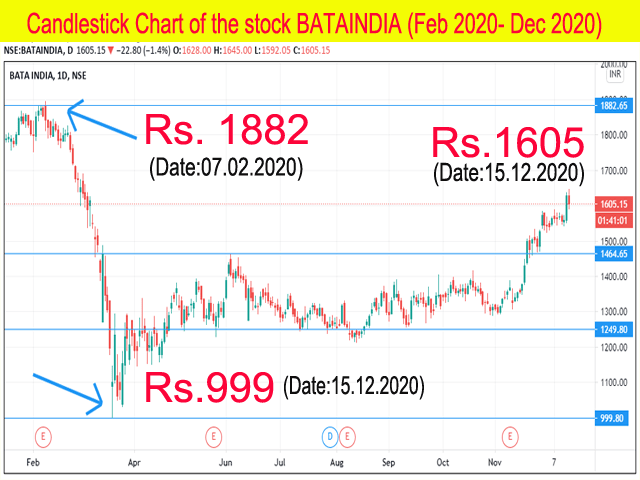
A very interesting, look at the chart. The stock is climbing, today on 15.12.2020 the stock is trading at around Rs:1610/-.
Probability
According to assumption – History tends to repeat itself. However we need to make an addendum to this assumption. When a set of factors that has panned out in the past tends to repeat itself in the future, we expect the same out come to occour, as was observed in the past, provided the factors are the same.
Possibilities
- Now, this stock may reach the top (Rs.1880/-) to repeat the history and before reaching there it has to take the support of price around Rs.1464. Because it Broke the resistance of Rs.1464/-. So before touching to Rs.1880/- possibility hight to come back again and consolidate for few days near Rs.1464/-
- It may come down to the low of Rs.999/- again by broking the support of Rs.1464/- if any bad news comes or with the bad global sentiment which has a low probability.
Note. This article is for educational purposes only. I am not recommending or encouraging you to buy or sell this stock. Because I am not a financial adviser. I wrote this article with my personal experience only. If this article helps you and for any query put a comment below.
