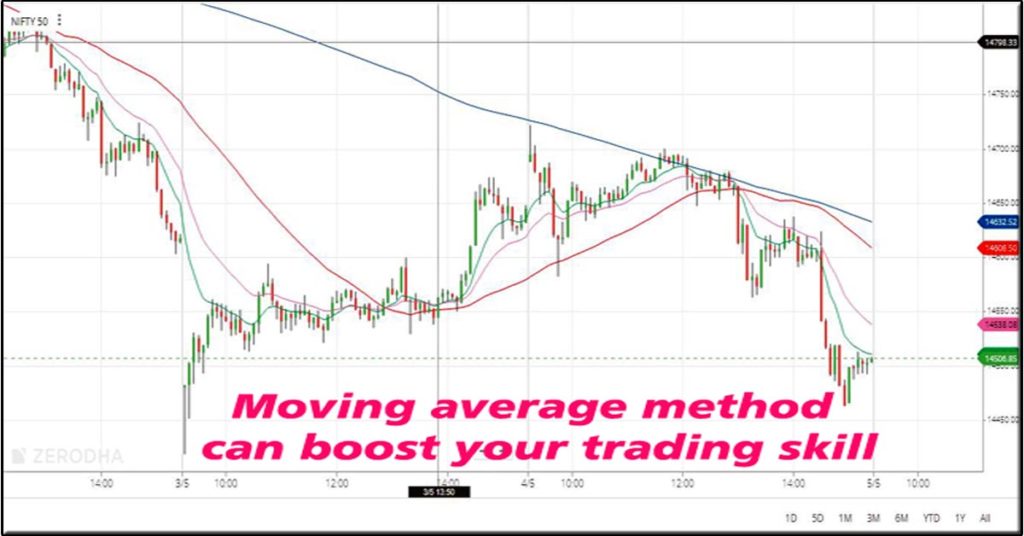
Moving average trick can boost your trading skill 2021
Moving average trick can boost your trading skill: How? Many people around the world do trade every day to enhance their wealth. But the fact is that a few of them get success. The remaining all others usually lose their capital. Trading in the stock market is very easy for anyone. But getting profit from […]
Moving average trick can boost your trading skill 2021 Read More »


