Trading is a common activity in the stock market. Many traders do their regular trading while some trade occasionally, all over the world. We discussed earlier in this blog that, Technical analysis is the key to success in the stock market.
Many traders apply technical indicators/oscillators in the price chart of the stock to identify the trend. The MACD Indicator is a widely used oscillator among traders and technical analysts which helps them to predict the bullish or bearish trend of a stock.
MACD Indicator:
The full form of this oscillator is Moving Average Convergence Divergence. For convenience to speak it, pronounced as “MAC-D”.
The close observation of its acronym “Moving Average Convergence Divergence“ represents something with its name. That name is made up of three words. Those are Moving Average, Convergence / Divergence.
If you can determine the meaning of those three words, you can be pictured the whole of this indicator and understand it easily. How to Use the MAC-D Indicator. I will help you to give complete information about the oscillator. Therefore, please stay here to read this article till the end.
Components of MAC-D
The following are the 4 components used in MAC-D Oscillator.
- MACD Line
- Signal Line
- Histogram
- Zero Line
1. MACD Line:
It is represented by a line that is created automatically with the value of the 12-period exponential moving average (EMA) minus the 26-period EMA.
2. Signal Line
The signal line is also represented by a line that is created with the value of the 9-period EMA of the MACD line.
3. Histogram
The histogram is plotted by the difference between two values of the MACD line and the signal line (9-day EMA).
The histogram is positive while the MACD line is above its signal line and negative when the MACD line is below its signal line.
4. Zero Line
The MACD line oscillates above and below the centerline. That center-line is called the zero line.
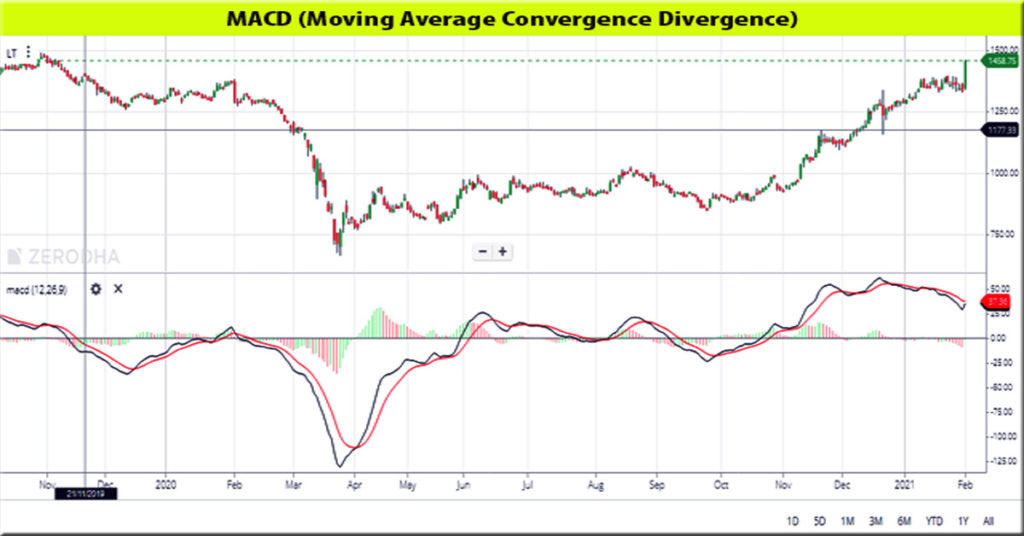
See the picture below where all the four components are leveled well for you to understand better.

Calculation of MAC-D
- MAC-D Line: (12 days EMA – 26 days EMA)
- Signal Line: 9-day EMA of MACD Line
- MAC-D Histogram: MACD Line – Signal Line
The MAC-D line is that the 12-day Exponential Moving Average (EMA) less than the 26-day EMA. The closing price is used for these moving averages.
To act as a signal line and identify turns, a 9-day EMA of the MACD Line is plotted with the indicator. The difference between MAC-D and its 9-day EMA, the signal line is represented by The MAC-D Histogram.
The histogram is positive while the MAC-D line is above its signal line and negative when the MAC-D line is below its signal line.
The default setting values of MACD used are 12, 26, and 9, But other values can be substituted depending on a traders’ trading style and goals.
Detailed interpretation of MACD Indicator
The MACD Indicator is all about the convergence and divergence of the 2 moving averages. When the moving averages move towards each other “Convergence” occurs and when the moving averages move away from each other “Divergence” occurs.
The shorter moving average (12-day) is responsible for most MACD movements, though it is faster and The longer moving average (26-day) is slower and less reactive to price changes in the underlying security.
The MACD line oscillates above and below the centerline (the zero line).
These crossover signals that the 12-day EMA has crossed the 26-day EMA. Of course, Such direction depends on the direction of the moving average cross.
Positive MAC-D occurs due to the 12-day EMA is above the 26-day EMA. And that Positive values increase because the shorter EMA diverges beyond the longer EMA. This means the upside momentum is increasing.
While the Negative MAC-D values indicate that the 12-day EMA is below the 26-day EMA. And the Negative values increase as the shorter EMA diverges further below the longer EMA. This means the downside momentum is increasing.
Signal Line Crossovers
The signal line is a 9-day EMA of the MAC-D line. Signal line crossovers are the foremost common MAC-D signals. As a moving average of the indicator, it trails the MAC-D and makes it easier to identify MAC-D turns.
When the MAC-D turns up and crosses above the signal line, a bullish crossover occurs. When the MAC-D turns down and crosses below the signal line, a bearish crossover occurs. Crossovers can last a few days or a few weeks, depending on the strength of their move.
Centerline Crossovers
Centerline crossovers are the subsequent commonest MAC-D signals. A bullish centerline crossover occurs when the MAC-D Line moves above the zero lines to show positive. This will happen while the 12-day EMA of the underlying security moves above the 26-day EMA.
A bearish centerline crossover occurs when the MAC-D moves below the zero lines to show a negative. This happens due to the cross-over of the 12-day EMA below the 26-day EMA.
Centerline crossovers can last a couple of days or a couple of months, counting on the strength of the trend. The MAC-D will remain positive as long as there’s a sustained uptrend. The MAC-D will remain negative when there’s a sustained downtrend.
Divergences
Divergences form when the MAC-D diverges from the worth-action of the underlying security. A bullish divergence forms when a security records a lower low and therefore the MAC-D forms a better low.
The lower low within the security affirms the present down-trend, but the upper low within the MAC-D shows less downside momentum. Despite decreasing, downside momentum remains in outpacing upside momentum as long because the MAC-D remains in negative territory.
Slowing downside momentum can sometimes foreshadow a trend reversal or a large rally.
A bearish divergence forms when a security records a better high and therefore the MAC-D Line forms a lower high.
The higher high within the security is normal for an uptrend, but the lower high within the MAC-D shows less upside momentum. Even though upside momentum could also be less, upside momentum remains to outpace downside momentum as long because the MAC-D is positive.
Sometimes, Waning upward momentum can be a foreshadowing of a trend reversal or sizable decline.
Conclusion
- The MAC-D indicator is a special one because of bringing momentum and trends together in one indicator. This unique blend of trend and momentum is often applied to daily, weekly, or monthly charts.
- The difference between the 12- and 26-period EMA is the standard setting for MACD. Chartists trying to find more sensitivity may try a shorter short-term moving average and an extended long-term moving average.
- MACD (5,35,5) is more sensitive than MACD (12,26,9) and could be better fitted to weekly charts.
- Chartists trying to find less sensitivity may consider lengthening the moving averages. A less sensitive MAC-D will still oscillate above/below zero, but the centerline crossovers and signal line crossovers are going to be less frequent.
- The MACD Indicator isn’t particularly good for identifying overbought and oversold levels. Even though it’s possible to spot levels that are historically overbought or oversold. The MACD indicator doesn’t have any upper or lower limits to bind its movement. During sharp moves, the MACD Indicator can still over-extend beyond its historical extremes.
- Finally, remember that the MACD line is calculated using the particular difference between two moving averages.
- This means MACD values are hooked into the worth of the underlying security. The MACD values for a $20 stock may range from -1.5 to 1.5, while the MACD values for a $100 may range from -10 to +10.
- It is impossible to match MACD values for a gaggle of securities with varying prices. If you would like to match momentum readings, you ought to use the share Price Oscillator (PPO), rather than the MACD.


